USD/JPY faces a pass or fail test
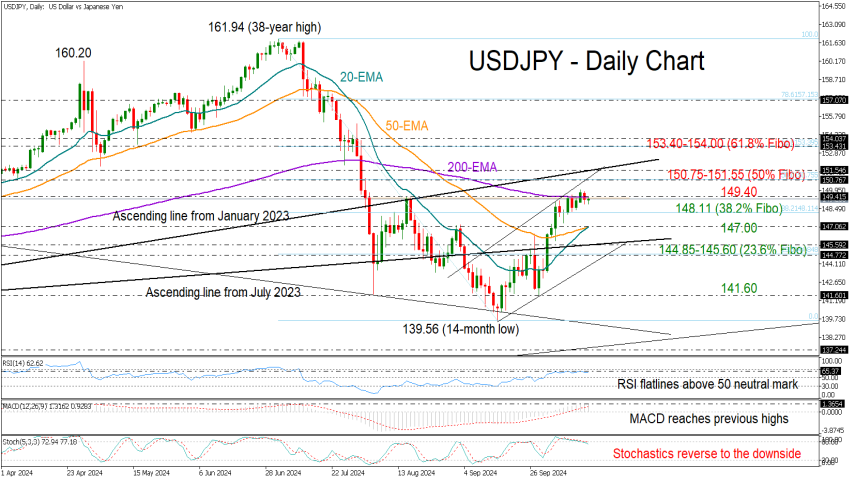
USDJPY reached a two-month high of 149.96, but it couldn’t hold its strength above the 200-day exponential moving average (EMA) at 149.40 on Tuesday.
Over the past few days, the pair has been struggling for a bullish breakout, leaving investors wondering whether it’s time for a negative pivot. The slowdown in the technical indicators reflects persisting reluctance among traders as the price hovers around August’s bar. Note that the MACD has reached its ceiling from July and April.
Still, with the RSI hanging comfortably above its 50 neutral mark and the 20-day EMA set to cross above the 50-day EMA, buying appetite may not entirely disappear. In this case, the pair may again attempt to stretch towards the 150.75-151.55 border. The 50% Fibonacci retracement of the July-September downtrend and the crucial support-turned-resistance line from the 2023 bottom are in that price neighborhood. Hence, a breach of that wall could excite buyers, speeding up the recovery process towards the 61.8% Fibonacci mark of 153.40 and the 154.00 barrier. Another success there could trigger a faster rally towards the 157.00 round level
https://one.exnesstrack.net/boarding/sign-up/a/qhhnixni2g/?campaign=25700

