Gold price traders seem non-committed, await US inflation data for Fed rate cut cues
Technical Analysis: Gold price bulls have the upper hand while above $2,448-2,450 resistance breakpoint
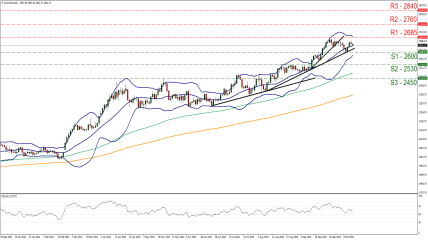
From a technical perspective, the recent rally from the 50-day Simple Moving Average (SMA) support and positive oscillators on the daily chart favor bullish traders. Hence, any meaningful slide might still be seen as a buying opportunity and remain limited. The Gold price seems poised to retest the record high, around the $2,483-2,484 area, and aim to conquer the $2,500 psychological mark. A sustained strength beyond the latter will mark a fresh breakout through a broader trading range held over the past month or so and set the stage for a further near-term appreciating move.
On the flip side, the $2,450-2,448 resistance breakpoint now seems to protect the immediate downside, below which the Gold price could slide back to the weekly low, around the $2,424-2,423 region touched on Monday. The next relevant support is pegged near the $2,412-2,410 area ahead of the $2,400 round-figure mark. Failure to defend the said support levels might turn the XAU/USD vulnerable to challenge the 50-day Simple Moving Average (SMA) support near the $2,378-2,379 region. Some follow-through selling might shift the bias in favor of bearish traders and expose the 100-day SMA support, currently near the $2,358-2,357 area. This is closely followed by the late July low, around the $2,353-2,352 area, which if broken should pave the way for deeper losses.
REGISTRATION LINK 👇🏻
https://one.exnesstrack.net/boarding/sign-up/a/uq2cbl5o/?campaign=24533


