Japanese Yen loses ground as BoJ Summary indicates no immediate plans for more rate hikes
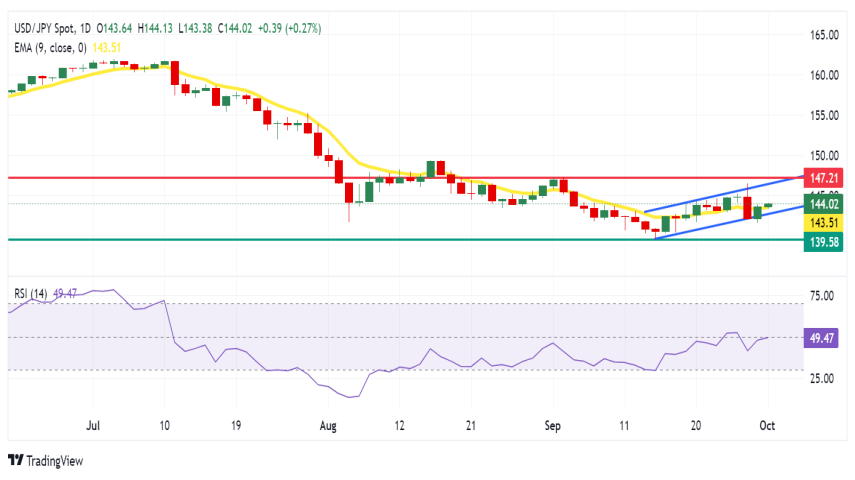
Technical Analysis: USD/JPY moves above 144.00, nine-day EMA
USD/JPY trades around 144.10 on Tuesday. Analysis of the daily chart shows that the pair has re-entered the ascending channel pattern, indicating that the bullish bias remains intact. Additionally, the 14-day Relative Strength Index (RSI) is slightly below the 50 level, and a break above this could further confirm the continuation of the bullish trend.
In terms of resistance, the USD/JPY pair could explore the area around the upper boundary of the ascending channel at 146.50, followed by its five-week high of 147.21 level, which was recorded on September 3.
On the downside, the immediate support appears at the nine-day Exponential Moving Average (EMA) at the 143.51 level, followed by the lower boundary of the ascending channel at the 142.80 level. A break below this level could lead the USD/JPY pair to navigate around the 139.58 region, the lowest point since June 2023.
REGISTRATION LINK

