Strong Yen Weighed on Japan’s Trade Balance in July, Fed Speakers up Next
JAPANESE YEN EASES AFTER SOMBRE TRADE DATA
The Japanese yen headed lower in the early hours of trading, aided by the disappointing trade stats, with the Canadian and US dollars leading the pack for now. It won’t be surprising to see muted moves ahead of the FOMC minutes and an expected downward revision to job gains between April 2023 and March 2024.
The combination of lower inflation, rate cut expectations and a weaker jobs market have contributed to the steady dollar decline, which may very well continue if the FOMC minutes and job revisions paint a bearish picture. USD/JPY could therefore manage another leg lower after recently consolidating.
Currency Performance Chart Showing Shorter-term Yen Depreciation

Source: FinancialJuice, prepared by Richard Snow
USD/JPY BEARISH CONTINUATION MAY RECEIVE A HELPING HAND FROM THE FED
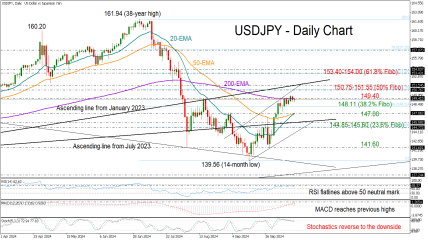
USD/JPY reached the swing low on Monday the 5th of August when volatility spiked as hedge funds rushed to cover carry trades. Since then, there has been a partial recovery as prices pulled back but ultimately, there has been a continuation of the more medium-term downtrend.
The US dollar has come under a lot of pressure as softer inflation and a worsening outlook in the jobs market has prompted traders to reduce USD exposure as the Fed prepare for the much-anticipated rate cut next month. This week’s Jackson Hole address from Jerome Powell will be followed with great interest. Speculation around a 25 bps or 50 bps cut continue to circulate, with markets assigning a 30% change the Fed will front load the rate cutting cycle.
The next level of support for USD/JPY lies at the spike low of 141.70, followed by the December 2023 low of 140.25. With some time to go until the BoJ is expected to hike, the catalyst of a further bearish move in USD/JPY is more likely to come from the US with the FOMC minutes, jobs revision, and Jackson Hole Economic Symposium all taking place this week. Resistance appears at the recent high at 149.40, followed by the 200-day simple moving average (red line) and 151.90 level.
USD/JPY Daily Chart


